Recently I enabled Sentry tracing in 1 of my side projects by adding the following piece of code:
import sentry_sdk

sentry_sdk.init(
    dsn="https://mydsnurl_of_sentry.io",
    traces_sample_rate=0.1,
)
The traces sample rates ensures that only 10 percent of my requests are traced. After I enabled tracing, I noticed that my login page was consistently the slowest page in my application. What the hell?!

Oof, a P50 of 806ms..
Confused, I decided to read into the trace that Sentry generated for this endpoint:

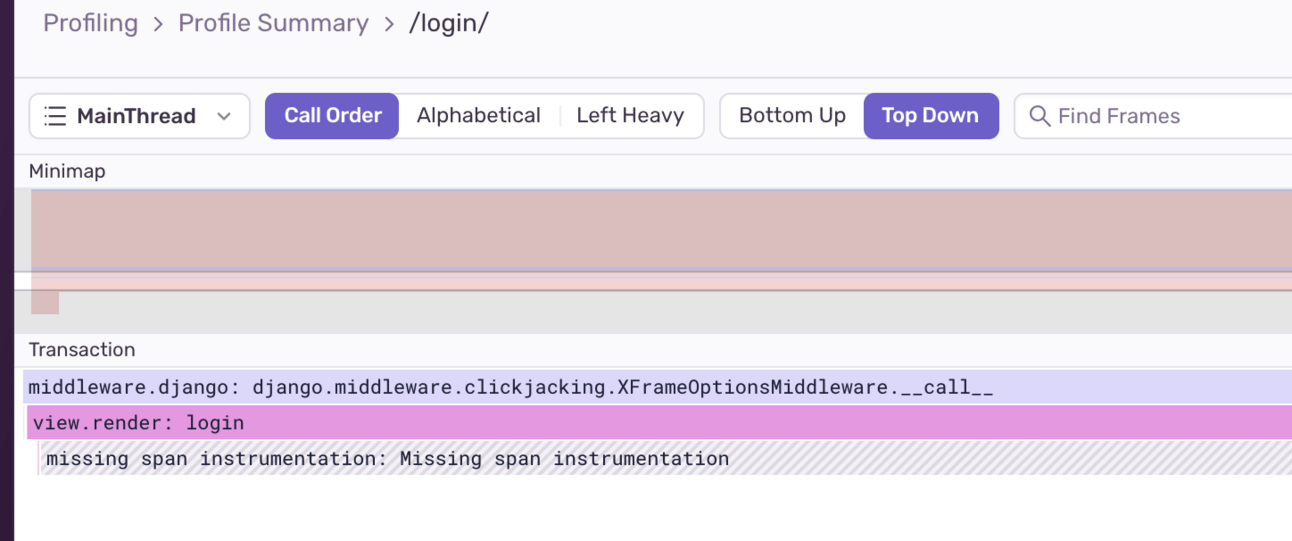
“Missing instrumentation” taking 744ms
Even more confused, I noticed that “Missing instrumentation” was taking 744ms. This simply means that Sentry has no instrumentation in this piece of code and therefore cannot measure what is taking so long. Or so I thought.
After some Googling, I figured that the issue must be the connection setup to Redis. I checked the Django application session and discovered that SESSION_ENGINE was set to "django.contrib.sessions.backends.cache" which in turn used Redis via django-redis.
So why would Sentry not instrument django-redis or Redis connections in general? This took me some time to figure out (and even ChatGippity couldn’t help me out here). Turns out Sentry has a setting to enable tracing spans over calls that go to cache:

Default is False, there’s your problem.
After seeing this, I opened a PR which did the following:
import sentry_sdk

sentry_sdk.init(
    dsn="https://mydsnurl_of_sentry.io",
    traces_sample_rate=0.1,
    DjangoIntegration(
       cache_spans=True,
    ),
)
After the above change had been deployed to production, I waited an hour and checked Sentry’s traces again for the POST /login/ endpoint. Again, “Missing instrumentation” showed up. More wtfs were spawned in my brain.
At this point I ended up, after some soul and Google-searching at this wonderful Github thread where one of the commenters explains nicely that whenever some piece of code spends more than roughly ~100ms doing something it shows up as “Missing instrumentation” in the Sentry trace.
Further on in the thread another commenter explains that profiling implies recording every function call at a certain sample rate while tracing (which is what Sentry does) is very selective in choosing what it instruments, namely, specific parts of the stack (http requests/db calls, etc) in a way that's immediately actionable, not noisy and has some semantic understanding of the code being instrumented (by way of span ops/descriptions).
Finally, at the end of the thread one of the engineers at Sentry announces that profiling is released. Nice! Let’s enable that:
import sentry_sdk

sentry_sdk.init(
    dsn="https://mydsnurl_of_sentry.io",
    traces_sample_rate=0.1,
    DjangoIntegration(
       cache_spans=True,
    ),
    profiles_sample_rate=1.0,
)
Now I could actually dig into the performance profile of the specific endpoint:

Still it shows “Missing span instrumentation” but…

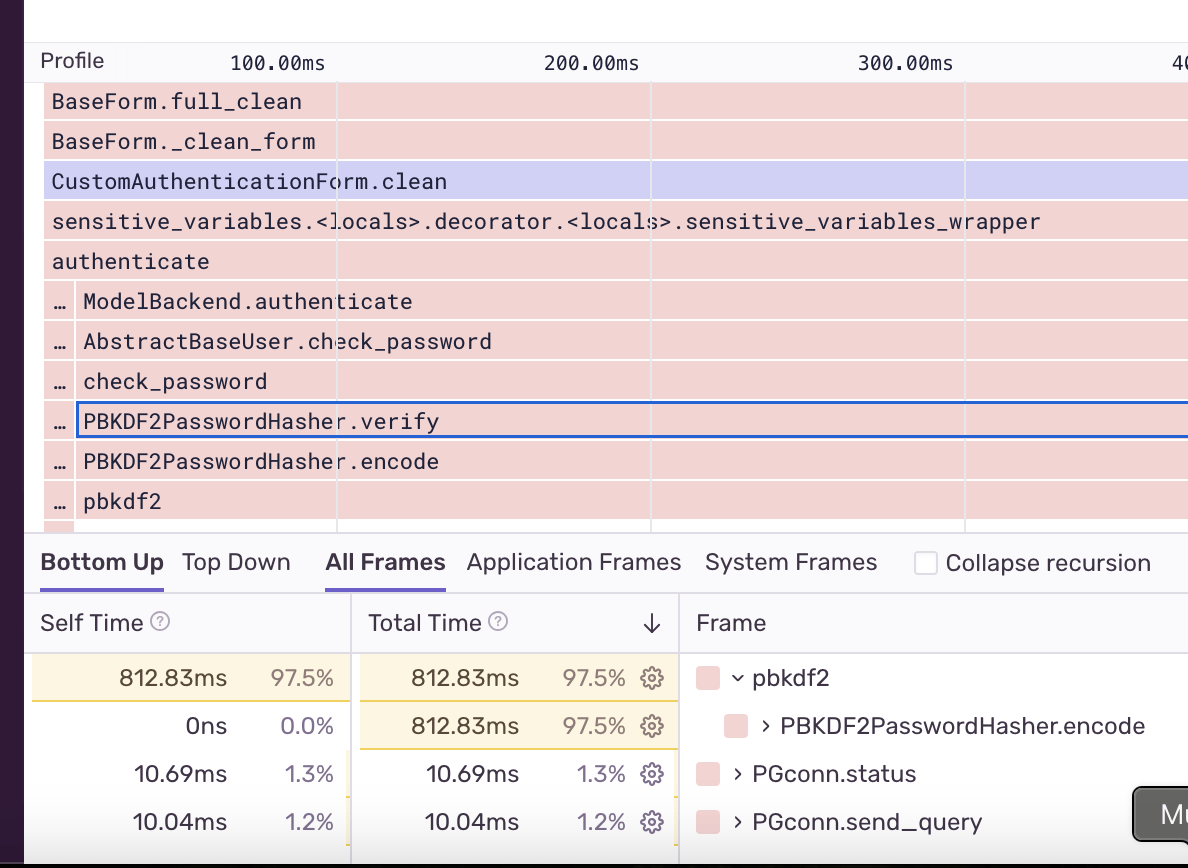
This screenshot tells the real story
There we have it. The reason why my login page is the slowest page of my app, is because of the PBKDF2 password hashing algorithm! It makes so much sense when you figure it out. According to the Django docs, the default amount of iterations of this hasher is 100 iterations, which is taking quite the time.
I guess that’s the downside of running my side projects on a 6$ per month DigitalOcean machine 😅…
I hope this helps someone running into the same “Missing instrumentation” error in Sentry. Now I will get back to reverting the cache_spans setting.
Do you like these kind of technical posts? Please consider subscribing to my newsletter, I would really appreciate that!
1 As a final note/confirmation, I enabled tracing on another Django app that I am running, which was not using Redis as a session cache and the same issue occurs. Time to upgrade that CPU on that machine.